

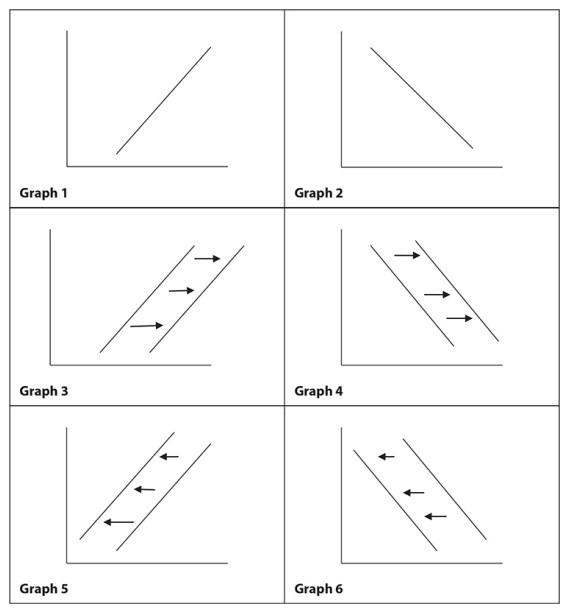
Indicate the graph that shows a demand curve showing the effects of new technology that results in a substitute product that is cheaper than the original product.
Explanation
As the new technology allows for a substitute product that is cheaper than the original product, demand shifts from the original product to the substitute product. As a result, at the same price, demand for the original product decreases. Demand curve shifts to the left.
Visit our website for other GED topics now!
Related questions