

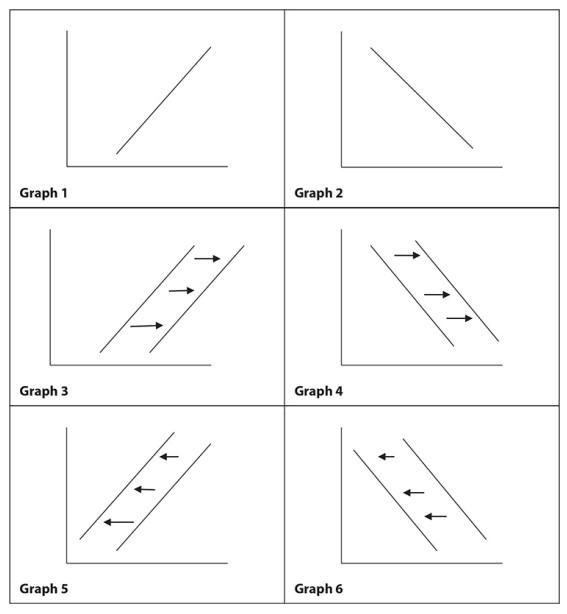
Which graph shows a basic supply curve?
Explanation
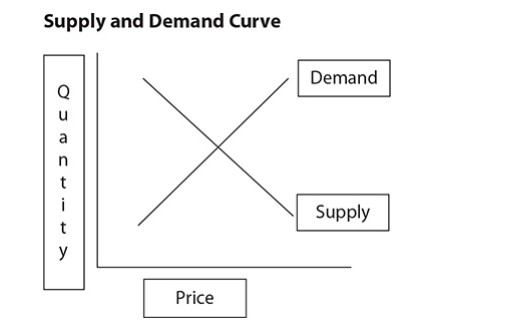
A supply curve represents the relationship between product price and quantity of a product. A supply curve has a rising upward slope due to the link between product price and quantity supplied (i.e., as the price of a commodity increases in the market, the amount supplied increases).
Visit our website for other GED topics now!
Related questions