

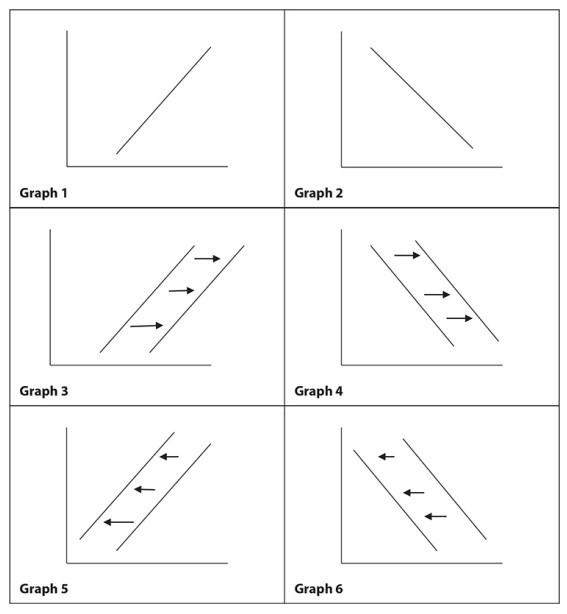
Indicate the graph that shows a supply curve showing the effects of new technology that allows for more efficient production.
Explanation
As new technology allows for more efficient production, the quantity of product supplied increases at the same price. The supply curve shifts to the right.
Visit our website for other GED topics now!
Related questions