

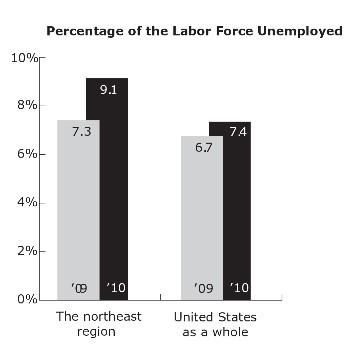
According to the graph, the difference in the employment rate in the northeast region from 2009 to 2010 represented a change of what percent?
Explanation
The first column shows the employment rate in the northeast region in 2009 and 2010. The change in percent is: 9.1 - 7.3 = 1.8.
Visit our website for other GED topics now!
Related questions