

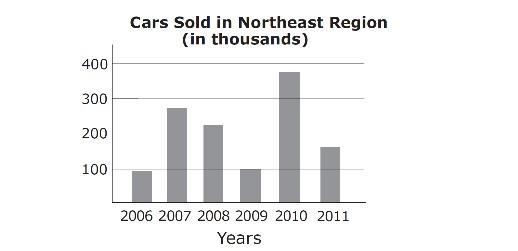
In the figure above, by approximately how much did sales of cars increase from 2009 to 2010?
Explanation
In 2009, according to the graph, 100,000 cars were sold. In 2010, about 370,000 were sold. The increase in car sales from 2009 to 2010 is \(370,000-100,000=270,000\).The answer closest to this number is (C).
Visit our website for other GED topics now!
Related questions