


Data from a Sanford C. Bernstein research study indicates that in a recent year, 9.6 billion cases of soft drinks were sold in the United States. The pie chart below summarizes the distribution of soft drink sales by location.
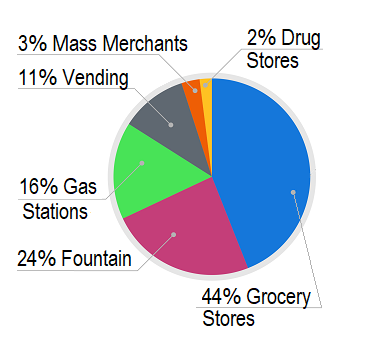
Based on the pie chart, the four largest locations for soft drink sales account for approximately what percentage of total soft drink sales in the year under consideration?
Explanation
The four largest locations are those taking up the four largest portions of the pie chart. Based on the pie chart, the four leading places for soft drink sales are grocery stores (44%), fountains (24%), gas stations (16%), and vending machines (11%); evaluate their sum to answer the question: 44% + 24% + 16% + 11% = 95%
Visit our website for other GED topics now!

